For the journalist who has never worked with large bodies of data (datasets), the act of ‘data journalism’ can sound daunting and complicated but it doesn’t have to be. Data journalism is simply the act of telling a story based on or incorporating structured data. This structured data can range from a simple Excel spreadsheet to a large database of information e.g. IMDB (they allow you to download plain text files via FTP) or a file downloaded from the US government’s data.gov, which hosts over 157,000 datasets on everything from the Consumer Complaint Database to U.S. Hourly Precipitation.
This kind of information can be searched and analysed for patterns that form the basis of your story. Databases can also be compared or cross-checked for further analysis.
For example, it is possible to write a piece on gender balance in Hollywood not only by interviewing key people but by analysing the ratio of male to female names listed in all Hollywood films on IMDB. You could do this by going through the list manually (not good practice for large datasets!) or use software created by others, such as Gender Gap Grader, which provides free analysis of names from any dataset you feed it.
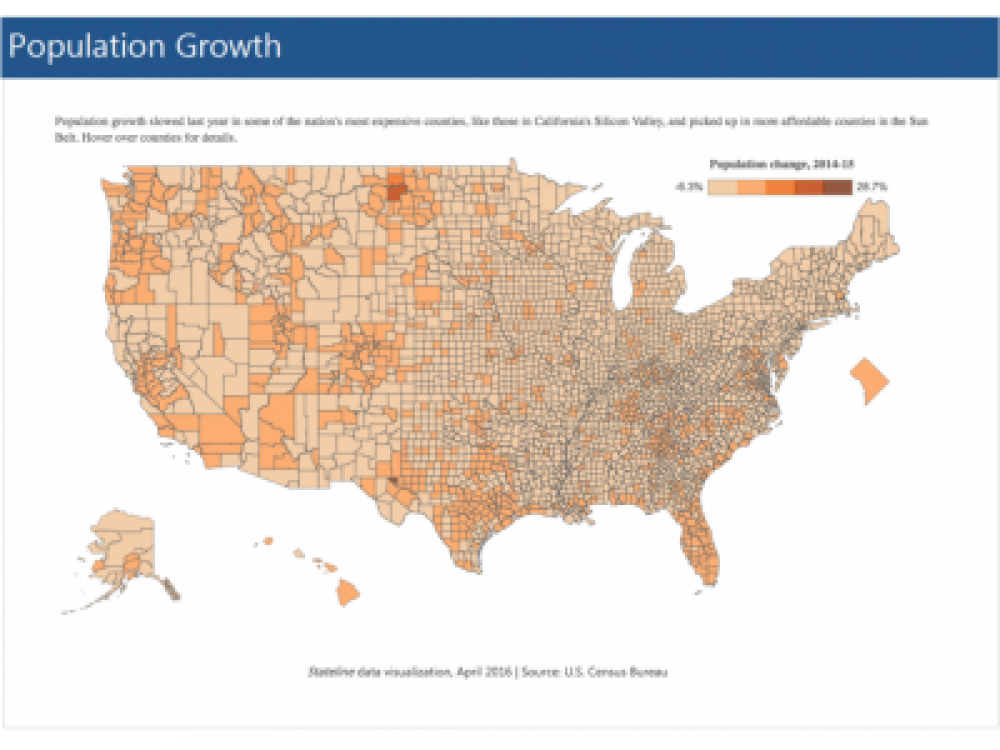
The last step in making a piece of data journalism more audience-friendly is the visualisation process. Numbers and statistics have more impact when there is an accompanying visual (interactive or otherwise). There are plenty of free tools to both analyse and visualise data. These can be easy to plug into your site or may require a little coding to embed.
This is why there is an argument for why journalists should be able to code: knowing how to extract information from databases and get that data looking pretty and on your blog or website can require anything from minor to major amounts of coding, depending on what you’re working on.
How do I get started?
The best place to start is by reading the Data Journalist’s Handbook. This free, open source handbook has been around for a few years: it is a collaborative effort from many data journalists, created in 2011 after a 48 hour workshop at Mozilla's MozFest. Sign up for the updates and get notified as new material is added.
The handbook is not a comprehensive resource and is not meant to be. It is enough to give you a good overview of what data journalism is, how it fits into the newsroom as well as some case studies showing how it works. Additionally, there is important information on the right to data, open data and freedom of information.
Where do I get my data?
Ireland
- Fingal Open Data: Launched in November 2010, this was the first Open Data website in Ireland
- Dublinked: Dublin Region Innovation and Open Data Initiative
- data.localgov.ie: Irish Local Government Open Data Portal
- data.gov.ie: Irish Government Open Data Portal
UK
- data.gov.uk: UK Government Open Data Portal
- http://www.data-archive.ac.uk: The UK'S largest collection of digital research data in the social sciences and humanities.
- OS Opendata: UK Ordnance Survey data
- Office for National Statistics: UK Government datasets
Other
- The World Bank: Free and open access to data about development in countries around the globe
- The Data Hub: A free, powerful data management platform from the Open Knowledge Foundation
- Reddit datasets: A frequently updates resource on datasets from the Reddit community
And now for something completely different
- Marvel Universe Social Graph: A dataset of how all the characters in The Marvel Universe interact
- Million Song Dataset: A collection of 28 datasets containing audio features and metadata for 1m popular music tracks
- Enron Email Data: Publicly released email dataset consisting of 1,227,255 emails with 493,384 attachments covering 151 custodians
Collecting Your Own Data
 Obviously, not all data comes packaged into neat datasets that can be imported into Excel or other programmes ready for analysis. You might want to extract data from a website or many webpages at once and this is possible by using software that automates web-scraping such as the open source Beautiful Soup, which can be used in conjunction with Python. Alternatively, there are web browser extensions that do this for you e.g. Scraper for Chrome.
If you simply want to get data from a PDF into an Excel spreadsheet then use PDF Tables: it a free tool that uploads PDF files and converts them into Excel files in your browser. For turning webpages into text use Readability; it takes any pages or articles you have saved onto your Readability account and converts them into a downloadable file of machine readable text.
Data Visualisation
There are many data visualisation tools out there that are ideal for journalists, the two most popular of which are Tableau and IBM Many Eyes. Rather than reinventing the wheel I'll point you towards Allison McCartney's blogpost on eight different data viz tools for journalists, what they do and how to use them.
If you are interested in how data viz is being used currently in newsrooms and how global organisations like BBC and MSNBC are adapting then watch the video below. It is an hour-long documentary made by Stanford Journalism's Geoff McGhee. Visit http://datajournalism.stanford.edu/ for more information on data viz sources, plenty of extra links and to see it broken down into individual chapters and key points.
Journalism in the Age of Data from Geoff McGhee on Vimeo.
